
MSc Major Research Project: Trust and Voter Advice Applications
Exploring the effect of trust principles and data visualisation on the trust users place in
Voter Advice Applications

Project Description
Voter Advice Applications (VAAs) have been subjected to much research since their inception. However, trust and data visualisation are two aspects of VAAs in which there is a lack of research. This research looked to address these gaps by carrying out a user centred design process while applying trust principles and data visualisation techniques to three prototype VAAs, before testing the level of trust, satisfaction, usability, and experience of their users. While the findings were not statistically significant for the primary topics, significant results were found in the perceived risk and appearance of these prototype VAAs suggesting that user centred design may have a role to play in the development of VAAs going forward.
Project Methodology
Tasks carried out during the empathise stage
Empathise
Following on from the literature review, the empathise phase consisted of several tasks. First, a survey was created and distributed to potential users to gain insight into their current usage of VAAs, how they make political decisions, and their demographic and political interest. Following the survey, five sample users were identified for interviews and observations as they completed two current VAAs with questions regarding their experience asked during the observation. During the user interviews, qualitative research was conducted, specifically their reasons for trusting websites, their thoughts on VAAs, and their interest and knowledge of voting. In addition to this, key experts identified during the literature review, Dr. Costello from the University of Limerick, and Karl Kane from Massey University Wellington, were reached out to for interviews to discuss their research.
Survey results
Age breakdown of survey respondents
Political views of survey respondents
VAA usage per age group
% of VAA users by their interest in politics
Somewhat interested in politics broken by age and previous usage of a VAA
Define
After carrying out the interviews, observations, and survey, this research was analysed to determine the repeating themes and problems that are common across varying users. From this, a persona, empathy map, and journey map were created to help guide the project in the next stages. The themes presented were researched further to find any best practices or principles which could be used in the following stages of the project.
Persona
Current journey map
To be scenario
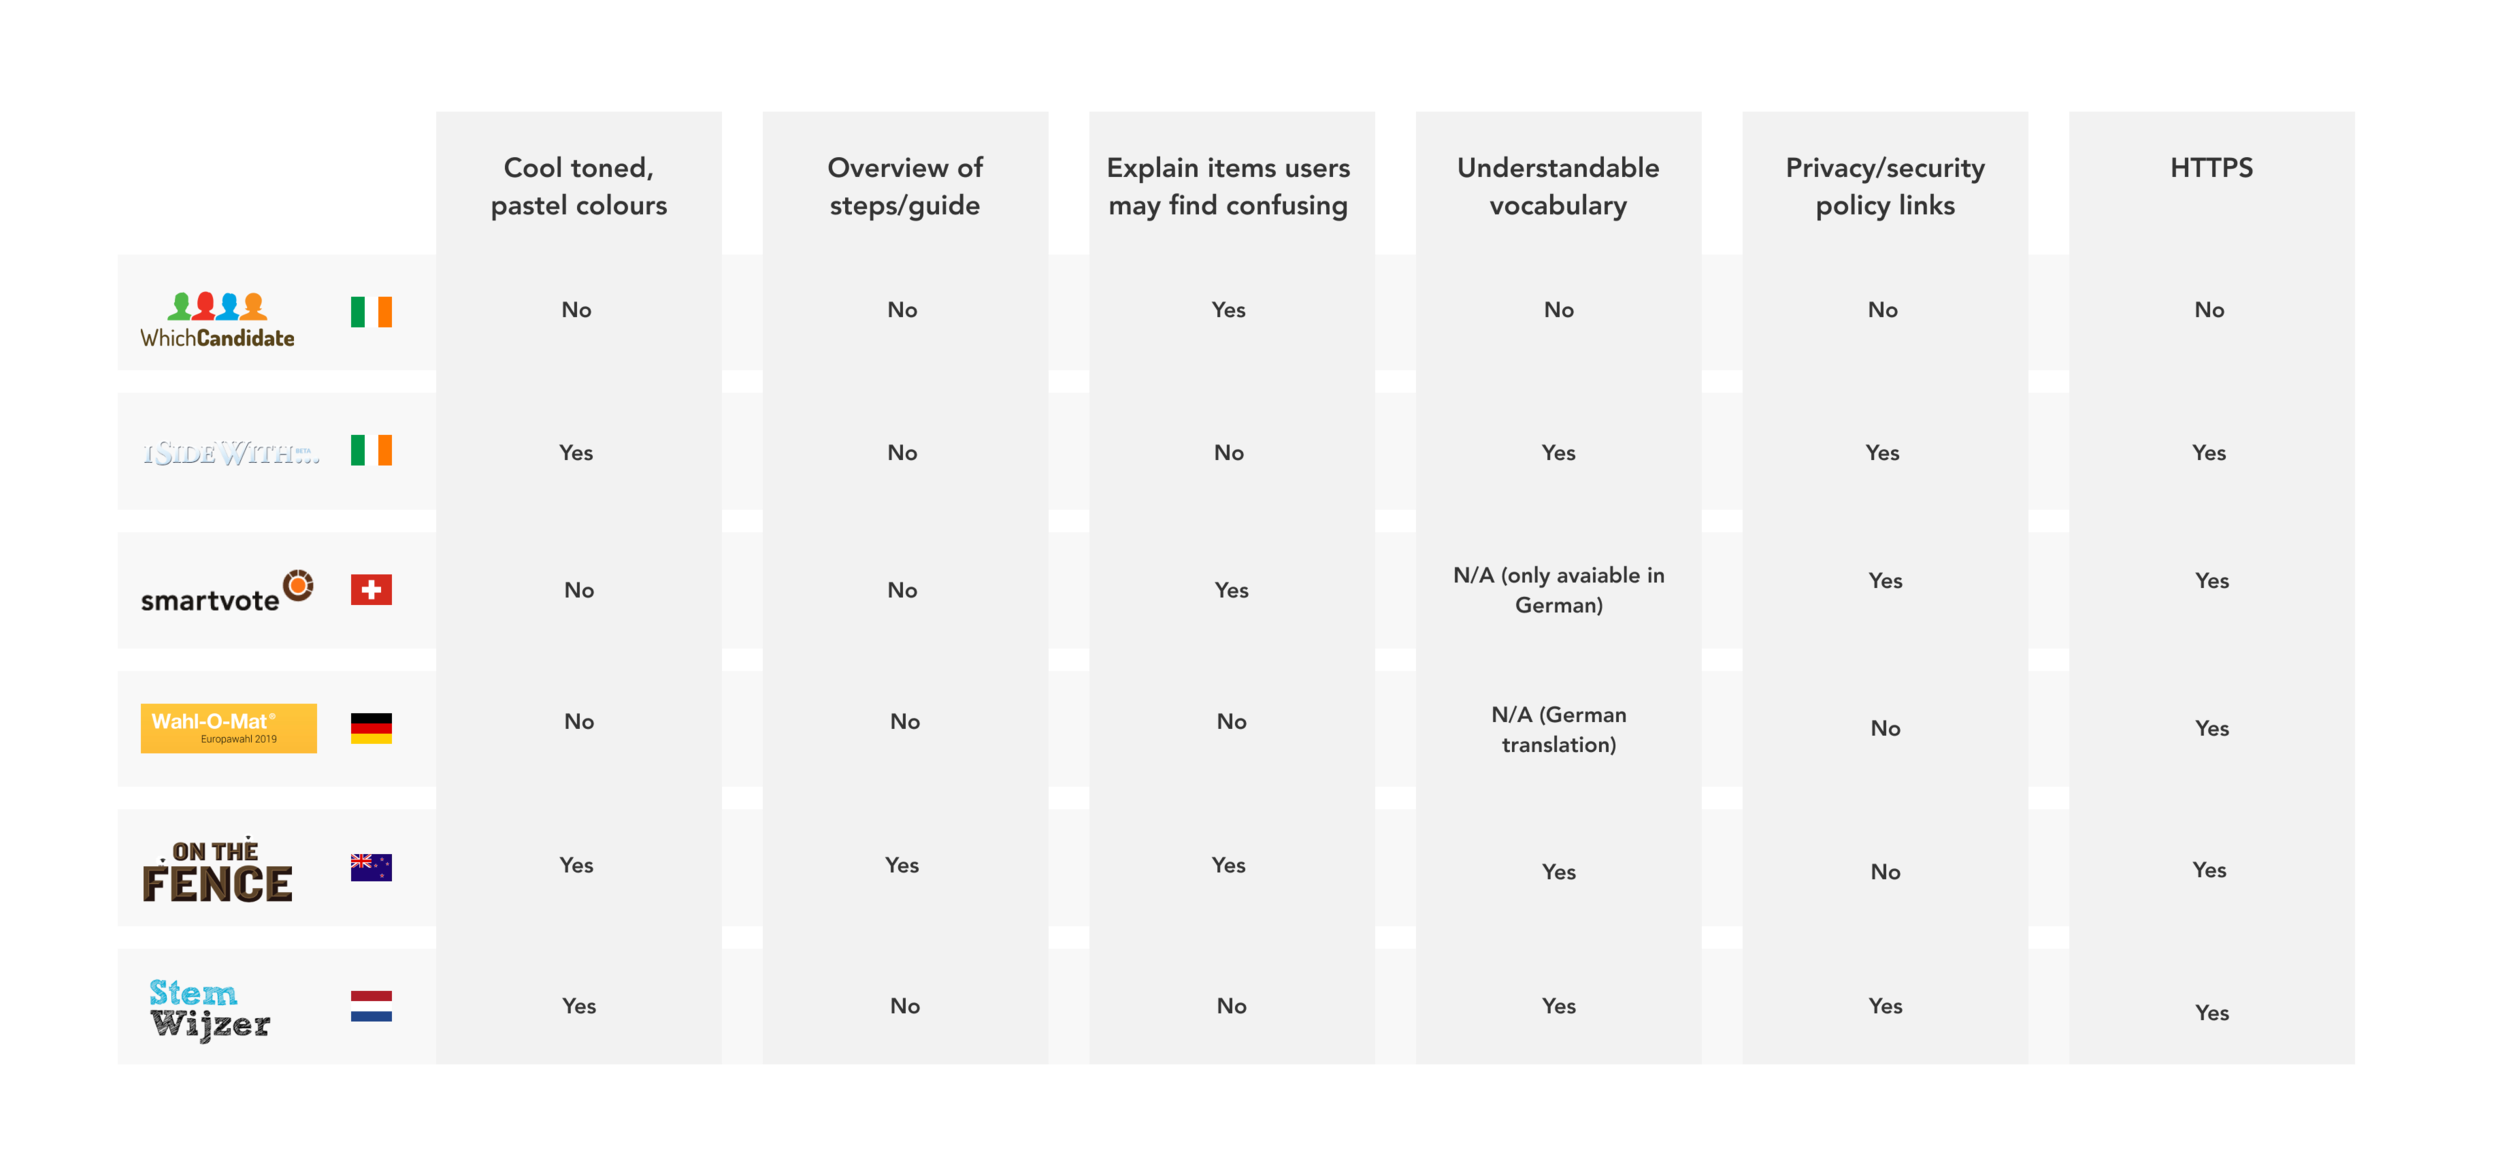
Competitor analysis


Tasks carried out during the define, ideate, prototype, and test stages.
Ideate
Next, brainstorming began to find the widest range of possible solutions to the problems found. During this phase, similar problems and themes in other industries were explored to gain lateral perspectives on the problems. A wide range of solutions were sketched and iterated on while working towards creating a design incorporating trust principles as well as a design incorporating data visualisation.
In addition, moodboards were created to visually show the elements which were discovered in the literature review regarding designing for trust and designing data visualisation.
Trust principles moodboard
Data visualisation moodboard
Avoiding political party bias
In addition to satisfying these requirements, a further mood board was created comprising of the logos and colour palettes of the political parties of Ireland. To ensure users didn’t assume there was bias towards a particular party, it was vital that the colour palette used in this application wasn’t overtly similar to any existing party.
Design iteration on trust and data vis prototypes
Prototype
The sketches from the ideation phase were first iterated on in the form of paper prototypes. Once the chosen solutions for both the trust principles prototype and the data visualisation prototype were decided, digital prototypes were created in Figma. Further iterations were created during this process before finalising the prototypes. A prototype was also created using WhichCandidate.ie as a foundation with a few minor changes to act as a control. This allowed users to answer the same questions as they are asked in the real VAA but rather than receiving a calculated result telling them which of Ireland’s political parties they are closest matched with, they were shown apolitical results with generic candidate and party names attached. The choice to show generic political parties was in an effort to remove the variable of current political identity from the experiment and to measure the user’s trust in as unbiased a way as possible.
Data visualisation prototype
Trust prototype


Test
Usability testing was conducted on the prototypes to catch any design flaws which may have impacted on the user experience of the designs. This also allowed user feedback to be gathered before running the experiment.
Implement
Tasks carried out during the implement stage.
The experiment was carried out as a mixed methods, between-subjects study using Maze (maze.co), a user testing platform, to host the tests. A pilot test was carried out to test the questions and the prototype in addition to testing the length of the experiment. While the experiment was ideally supposed to be conducted as a within-subjects experiment, it was decided to switch to a between-subjects study for several reasons such as the time it would take participants to complete, carryover effect, and Maze limitations.
The prototype which participants interacted with was assigned at random using a link splitter to direct them to one of three Maze links. Users were asked to fill out a questionnaire before using the VAA as well as a number of surveys and qualitative questions afterwards.
Results
As the persona and the other two VAAs focus on 18-34 year olds, these were the main focus of the experiment. Each of the six hypotheses were tested for 18-34 year olds for this reason. In addition, they were tested for the full list of participants as well as those in the over 35 group to see if there were any significant results between the age groups.
There were no significant results for any of the scales across any of the participant groups and therefore all of the hypotheses were rejected.
While none of the hypotheses could be proven, there were some statistically significant findings within the subscales of trust and satisfaction.
While the initial test showed significance in risk within the trust scale for 18-34 year olds, no significant cause could be found. However, risk in the trust scale was shown to have a significant cause in both the all participants group and the over 35 group with the group of all participants finding the trust prototype to be less risky than the control and the over 35s finding the trust prototype to be less risky than the data visualisation prototype.
In addition the 18-34 year olds found the appearance of the data visualisation prototype to be better than the control.
Final results for hypotheses
Subscales with significant differences